
State profile
Missouri
Where federal work lands across the state.
FY2026 ended Sep 30 · data still posting · data as of 2026-11-01†
† DoD contract data posts to USAspending about 90 days after award.
$97.4B
Work performed here
FY2026 · data still posting
75
Recipients
Department of Social Services Misso
Top recipient
In FY2026, federal awards worth $97.4B were performed in Missouri, by 75 recipients. The largest recipient with work in the state was Department of Social Services Misso, at $16.5B. FY2026 ended Sep 30 and its data is still posting. Computed
Obligations by year
Computed$81.7B
FY20
$86B
FY21
$76.6B
FY22
$86.2B
FY23
$92.4B
FY24
$93.8B
FY25
$97.4B
FY26 partial
▲ 15%
FY20 to FY25
Top federal award recipients with work here
Recipient breakdown available for 34% of obligations shown
Representation
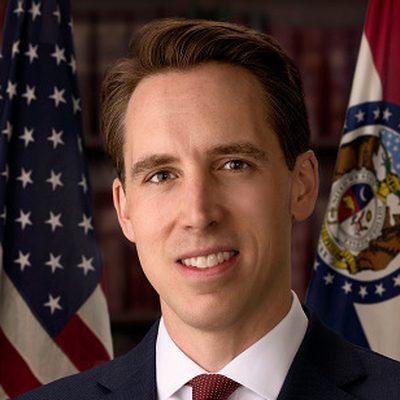
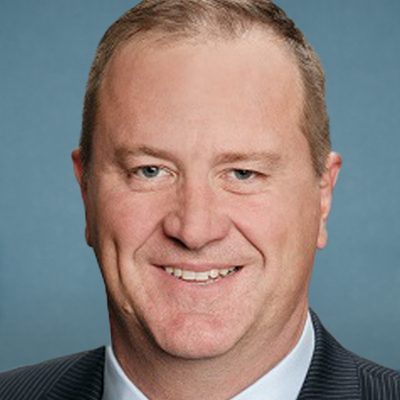
Spending here is geographic context, not funding directed by these members.
Congressional districts in Missouri
MO-01Inferred$30.3B
MO-05Inferred$7.7B
MO-03Inferred$6.4B
MO-07Inferred$5.5B
MO-06Inferred$5B
MO-08Inferred$5B
MO-04Inferred$4.8B
MO-02Inferred$1.2B
Inferred district figures are inferred from place-of-performance addresses, not asserted as fact.
Largest awards performed here
awarded 2015$18.1B
awarded 2025$14.2B
awarded 2022$12.5B
awarded 2024$11.6B
awarded 2023$11.3B
awarded 2012$11.2B
awarded 2021$10.3B
awarded 1999$9B
Awards whose place of performance is recorded in this state, largest by total value.
Related
Why the labels? The graph is only worth anything if the links are trusted. Facts taken straight from a federal filing are Source; figures we calculate are Computed; links we infer (corporate parents, districts, similar contractors, connections between records) are Inferred, worded carefully, never asserted as fact and never a claim that one thing caused another. Spot an error? Tell us.